Power Graph Explained v2.0
Since my first experiment to determine what the Power Graph actually measures, I have conducted a number of more precise follow up experiments. Having tested nine variables, only three factors are included in the Power Graph: Net Population, Tech Levels, and Money.
Basics:
The power graph records the relative strengths of civilizations every four turns. The Power Graph is updated on turns that correspond with those identified by Oedo in "Switching Governments"; however, while the graph is updated on these turns, inclusive of the measurement of tech levels and money, the measurement for net population is actually made on the turn previous. For example, the first change in the Power Graph is illustrated in the year 3850 B.C., but it actually measures the net population in the year 3900 B.C..
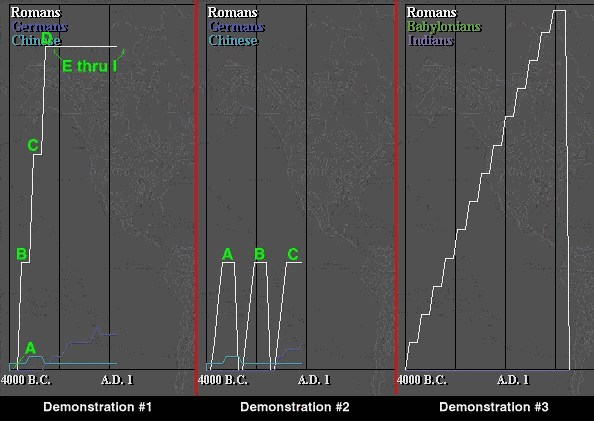
To illustrate the points made in the following demonstrations, I have included an illustration that combines three different Power Graphs, one from each demonstration. In each demonstration, all the tested variables are held constant for at least twelve turns, or three separate measurement periods, primarily to make the illustration more clear.
Demonstration 1: What effects a Power Graph?
| 4000 B.C.: (A) | Barbarians set at Raging Hordes for +25 points; this has no effect on the Power Graph for the first three measurements. |
| 3350 B.C.: (B) | Rome given 40 techs; this is the first jump in the Power Graph |
| 2750 B.C.: (C) | Rome given 3840 in gold; this is the second jump in the Power Graph |
| 2150 B.C.: (D) | Rome is founded; Population established at 15; this is the third and final jump in the Power Graph. (Note that these measurements are taken with an established Fundamentalist government such that all citizens will remain content but not happy until 375 B.C.; likewise, throughout the remainder of this demonstration, the amount of gold and techs are held constant so as not to effect the rest of this demonstration.) |
| 1550 B.C.: (E) | 20 Wonders of the World are added to Rome; this has no effect. |
| 975 B.C.: (F) | 20 Armor units are added to Rome; this — and all other military units — have no effect. |
| 675 B.C.: (G) | 18 city improvements added to Rome; this has no effect. |
| 375 B.C.: (H) | Remaining Wonders added; Government switched to Democracy and Luxury Tax set at 100%, resulting in 11 happy citizens and 4 content citizens. This has no effect on the Power Graph, demonstrating that graph measures the net population of citizens, and does not include the “bonus” for happy citizens. |
| 75 B.C.: (I) | 20 pollution “skulls” added to Rome; this has no effect. |
Demonstration 2: Relative Weight of Measured Variables
| 3750-3350 B.C.: (A) | 40 total techs added in 3 increments of 13, 14, 13 tech levels; tech levels removed in 2750 B.C. |
| 2350-1950 B.C.: (B) | 3840 total gold added in 3 increments of 1280; money removed in 1350 B.C. |
| 975-775 B.C.: (C) | 15 total population added in 3 increments of 5. |
The results on the Power Graph demonstrates the relative weight of these three variables:
40 techs = 3840 gold = 15 citizens
– or –
1 citizen = 2.67 techs = 256 gold
Demonstration 3: Compression of Power Graph as Score Rises
The first two demonstrations have been done on an “early game” Power Graph. The last part of the attached illustration demonstrates an “end game” Power Graph after scoring has reached higher levels. Each step in this final segment represent incremental jumps in the net population of 20; techs and money have been held constant so as not to effect this graph. The graph maxes out at the equivalent of a net population of 264; after many attempts — during which I learned that population is measured the turn before the Power Graph is updated (!!!) — I determined that a downward spike occurs when the score reaches the equivalent of a net population of 4096.
Because the early game Power Graph goes up to about 57, the Power Graph begins to “compress” once the score passes the equivalent of a net population of 58, reaching its final form once it is maxed out at 264. Note that by the end of the game, “all techs given” is the equivalent of a net population of only 32; while 30,000 gold is the equivalent of a net population 117. More than anything else, therefore, the Power Graph ultimately measures net population.

Thanks Andu Indorin for his time and effort in explaining the elements that affect the Power Graph. It is definitely one of the most fascinating discoveries in the world of Civilization. Send your appreciation to AStoll2525@aol.com.
